Ethereum's SuperTrend Just Flipped to "Buy" for the First Time Since September Here's What Happened Last Time
After six consecutive months of decline the longest red streak since the 2018 bear market
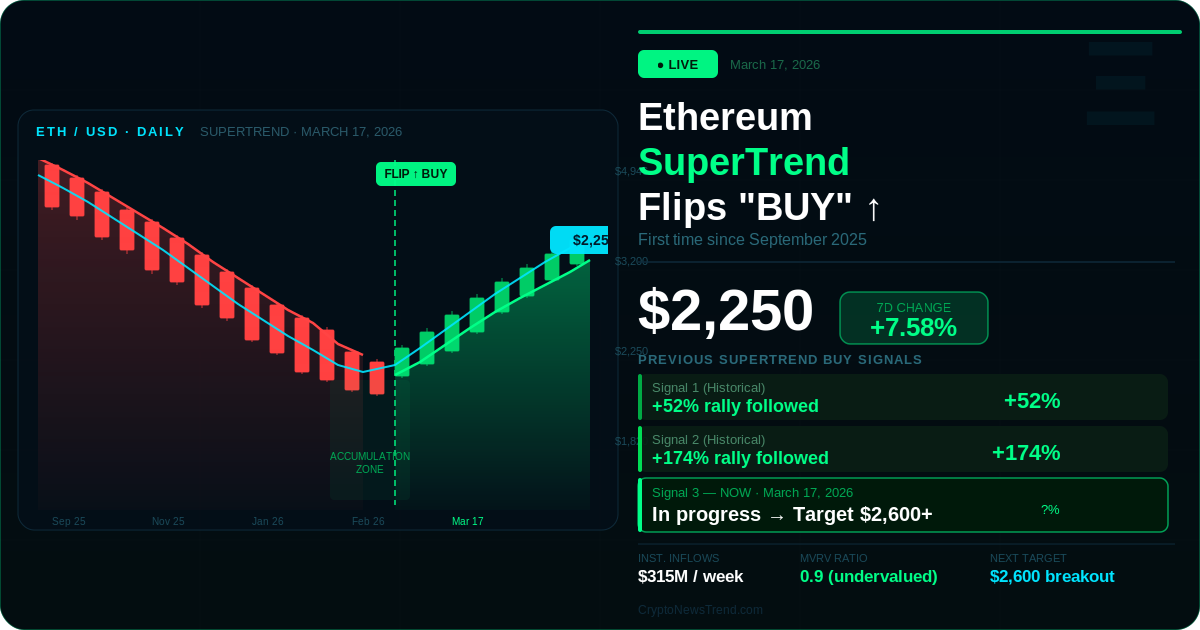
Ethereum has finally broken the pattern. The SuperTrend indicator
on Ethereum's daily chart has switched from "Sell" to "Buy" for the first time since
September 2025 a volatility-based signal that technical traders rely on to identify
fundamental shifts in market momentum. ETH is now trading around
$2,250, up 7.58% over the past week and 8.91%
over the past month and institutional money is flowing back in at a
pace not seen since mid-2025.
Last week alone, institutional investors poured $315 million
into Ethereum ETFs, narrowing year-to-date outflows significantly. Analysts are now
eyeing $2,800 as the next major target based on both technical and on-chain
analysis.
Live Market Data March 17, 2026
| Metric | Value | Signal |
|---|---|---|
| ETH Price (Now) | ~$2,250 | 🟢 Above 50-day EMA ($2,211) |
| 24h Change | +1.07% | 🟢 Holding gains |
| 7-Day Change | +7.58% | 🟢 Bullish weekly close |
| 30-Day Change | +8.91% | 🟢 Trend reversal confirmed |
| RSI (Daily) | 62 | 🟢 Bullish not yet overbought |
| MACD (Daily) | Above signal line | 🟢 Green histogram expanding |
| SuperTrend (Daily) | BUY flipped green | 🟢 First since Sept 2025 |
| Fear & Greed Index | 15 Extreme Fear | 🟡 Contrarian buy zone |
| MVRV Ratio | ~0.9 | 🟢 Below 1 = historically undervalued |
| Exchange Reserves | All-time lows | 🟢 Supply shock building |
What Is the SuperTrend Indicator and Why Does It Matter?
The SuperTrend is a volatility-based trailing indicator that sits above or below price
depending on whether the trend is bearish or bullish. When it flips from red to green
on the daily chart, it signals a fundamental shift in momentum not just a short-term
candle pattern. According to analyst Ali Martinez, the previous
two times Ethereum's daily SuperTrend switched from Sell to Buy, the price went on to
rally 52% and 174% respectively.
Previous SuperTrend Flip
ETH Price at Flip
Peak After Signal
Rally Size
The Six-Month Grind That Led Here
Ethereum has posted six consecutive red monthly candles a
streak only matched once before in its entire history, during the 2018 bear market,
where the seventh month marked the cycle low. ETH dropped more than 60%
from its August 2025 all-time high of $4,946, reaching a low
of around $1,820 in late February 2026.
The decline was caused by macro headwinds the US-Iran conflict driving oil above
$100, recession fears, and panic selling triggered by Vitalik Buterin's ETH sales.
But beneath the surface: more than 31.6 million ETH were
withdrawn from exchanges in February 2026 the highest outflow level since November
of the previous year causing the Liquidity Ratio on Binance to surge to 8.47,
indicating intense accumulation pressure.
Ke y Price Levels Where ETH Goes From Here
| Level | Price | Significance |
|---|---|---|
| Immediate Resistance | $2,302 | Weekly pivot must close above |
| Next Resistance | $2,434 | Recent cluster of selling activity |
| Major Breakout Level | $2,600 | A break here could greatly alter ETH direction for 2026 |
| 100-day EMA Target | $2,517 | Daily close above 50-day EMA opens path to 100-day EMA |
| Analyst Target | $2,800 | On-chain + technical consensus target |
| First Support | $2,090 | Daily close below = flip failed signal |
| 50-day EMA Support | $2,211 | Initial support improving structural outlook |
| Deep Support Floor | $1,910 | Long-term holder accumulation accelerated here |
Four Catalysts Behind This Recovery
1. BlackRock ETHB Staked ETH ETF ($106M AUM)
BlackRock's new iShares Ethereum Staking Trust (ETHB) launched March 12 with
$106 million in initial assets and 3.1% annual yield creating a new class
of institutional demand that buys and holds ETH rather than trading it.
Institutional investors poured $315 million into Ethereum
ETFs last week alone, narrowing year-to-date outflows significantly.
2. Glamsterdam Upgrade 10x Throughput Coming H1 2026
Glamsterdam is the next scheduled hard fork targeting
H1 2026. Key features include Enshrined Proposer-Builder Separation (ePBS)
to decentralize block building and mitigate MEV centralization, alongside
continued gas fee and data blob optimizations to support Layer 2 growth.
The upgrade lays the groundwork for reducing block times from the current
~12 seconds. Pre-upgrade accumulation is historically a reliable
bullish pattern for ETH.
3. Yellow Network Layer-3 Goes Live on Ethereum
Yellow Network, a Layer-3 protocol built for
non-custodial, cross-chain trading via off-chain state channels, deployed
on the Ethereum mainnet on March 16, 2026. The network allows participants
to operate nodes and build applications, with over 500 apps in development
expanding Ethereum's DeFi infrastructure and driving fresh on-chain
activity.
4. CLARITY Act 72% Chance of Senate Passage in 2026
The CLARITY Act which passed the House 294-134 in July 2025 is in
active Senate negotiations. If passed, it would provide
regulatory clarity for DeFi applications built on Ethereum, potentially
unlocking a new phase of institutional adoption. With 55% of stablecoins
settling on Ethereum, the growth of the $183 billion stablecoin market
directly drives Ethereum network fee revenue.
Th e Critical Wildcard: Fed FOMC March 18
The key near-term trigger for Ethereum is the Federal
Reserve's policy decision on March 17–18. If ETH holds above the $2,050–$2,000
support zone, it could retest $2,150 resistance; a break below risks a move
toward $1,950. A Bitcoin re covery above $80,000 would typically
be followed by amplified ETH outperformance making Wednesday's Fed decision
a critical catalyst for Ethereum as much as for Bitcoin.
Ethereum Price Prediction 2026 Analyst Comparison
| Source | ETH Target | Timeframe | Basis |
|---|---|---|---|
| CoinCodex | $2,441 | Mid-April 2026 | Algorithmic + technical model |
| CoinCodex | $2,713 | September 2026 | +27.5% from current levels |
| Changelly | $2,520 | End of March 2026 | Technical + sentiment model |
| Changelly | $4,271 | December 2026 | Bull case year-end |
| CoinDCX | $2,560 | End of March 2026 | SuperTrend + Glamsterdam catalyst |
| On-chain Analysts | $2,800 | Q2 2026 | MVRV recovery + ETF inflows |
| Standard Chartered | $40,000 | Early 2030s | "Year of Ethereum" long-term thesis |
Disclaimer: These are third-party predictions only and do not constitute
financial advice. Cryptocurrency markets are highly volatile.
On-Chain Data Confirms Accumulation Phase
| On-Chain Metric | Reading | What It Means |
|---|---|---|
| MVRV Ratio | ~0.9 | 🟢 Below 1 = historically undervalued bear cycle floor |
| Exchange Reserves | All-time lows | 🟢 Less sell pressure supply shock building |
| Binance ETH Supply | Only 3.5M ETH | 🟢 Extremely low strong accumulation |
| Feb 2026 Exchange Outflows | 31.6M ETH withdrawn | 🟢 Highest since November 2025 |
| Binance Liquidity Ratio | 8.47 | 🟢 Same ETH being rotated repeatedly strong demand |
| Institutional ETF Inflows | $315M last week | 🟢 Capital rotation confirmed |
FAQ Ethereum SuperTrend Buy Signal March 2026
What is Ethereum's SuperTrend signal saying right now?
The SuperTrend on Ethereum's daily chart has flipped below
the price, acting as trailing support with the MACD holding above its signal line
and green histogram bars expanding, and the RSI at 62 confirming improving bullish
pressure without yet reaching overbought conditions.
What is t he next key resistance for ETH?
Three levels to watch: $2,302 (weekly pivot), $2,434
(selling cluster), and $2,600 the major
breakout level where a conviction close could greatly alter Ethereum's direction
for the remainder of 2026.
Why did E thereum drop so much in early 2026?
Ethereum posted six consecutive red monthly candles
matched only during the 2018 bear market driven by the US-Iran conflict, Vitalik
Buterin's ETH sales, recession fears, and broader crypto market weakness from Fed
rate uncertainty.
How much did institutions invest in Ethereum ETFs last week?
Institutional investors poured $315 million into Ethereum
ETFs last week, narrowing year-to-date outflows significantly the strongest
single-week institutional inflow since mid-2025.
What is t he Glamsterdam upgrade?
Glamsterdam is Ethereum's next major hard fork, targeting
H1 2026. It aims to deliver 10x throughput improvement through Enshrined
Proposer-Builder Separation and advanced gas optimization laying the groundwork
for progressively reducing block times from the current 12 seconds.
Is now a good time to buy Ethereum?
The Fear and Greed Index is at 15 Extreme Fear
which historically represents a contrarian buy zone. The MVRV ratio below 1.0
indicates ETH is trading below its realized value, a metric that has historically
marked bear market floors. However, always do your own research before
making investment decisions.