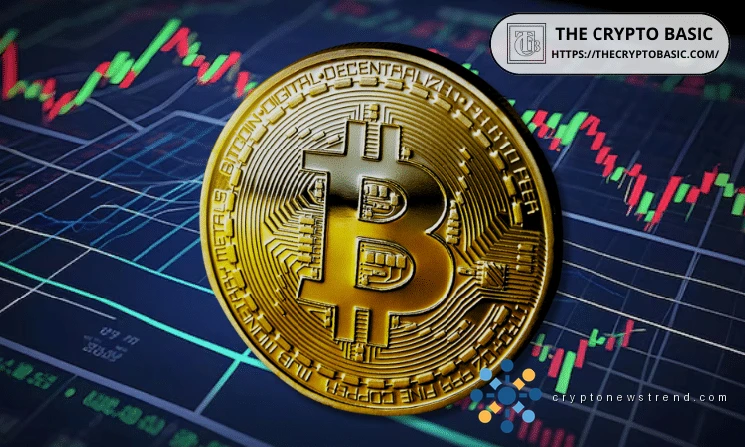
Cryptocurrency Markets See Shift as Indicators Suggest Bitcoin's Downward Trend May Be Reversing
Bitcoin is beginning to show signs that the recent downtrend may be losing momentum, with several on-chain indicators suggesting a bottom.
Notably, Bitcoin ($BTC) has yet to start its famous bull phase, characterized by massive price surges. Still, on-chain data suggests the market may be entering a stabilization phase, signaling a shift away from the intense selling pressure seen earlier in the cycle.
Key Points
Market analyst Ali Martinez highlighted three factors suggesting Bitcoin may have bottomed.
One of the clearest signals comes from the Sharpe Ratio, which has recovered from -43 recently to 20.35.
Data shows the share of network value held by recent buyers has fallen below 7%, a level historically associated with early bull phases.
Recent flows show Bitcoin increasingly moving toward derivative platforms.
Bitcoin has held above a key support level near $73,700, which aligns with the -0.5 MVRV pricing band, and holding it paves the way for $96,000.
Signs that Bitcoin Has Bottomed
In an X commentary, market analyst Ali Martinez highlighted three reasons why Bitcoin, the largest cryptocurrency by market cap, has bottomed. The view joins a growing class of prominent market observers claiming that its February lows around $60,000 might just be the asset’s base.
According to Martinez, one of the clearest signals comes from the Sharpe Ratio, a metric used to assess returns relative to risk. After dropping to deeply negative levels near -43 recently, the ratio has rebounded into positive territory, reaching 20.35.
Bitcoin Sharpe Ratio/CryptoQuant
Martinez noted that this type of recovery typically reflects a transition from uncertainty to more balanced market conditions, in which volatility is being absorbed, and price action begins to normalize.
Declining Retail Activity and Supply Shift
Another important trend is the sharp decline in short-term holder dominance. Data from CryptoQuant tracking the share of network value held by recent buyers shows that this segment has fallen below 7%, a level historically associated with quieter market phases.
When this happens, it often indicates that speculative activity has faded and that the remaining supply is concentrated among longer-term holders.
Bitcoin realized Cap Percentage/CryptoQuant
A recent report from The Crypto Basic confirmed this, too. Over the past 30 days, short-term holders have sold 290,000 $BTC, while long-term holders have acquired 303,000 $BTC. During this period, institutions like Strategy have procured 53,000 $BTC, and the Bitcoin spot ETFs have attracted 16,800 $BTC.
According to the analyst, this shift tends to reduce immediate selling pressure because long-term participants are generally less responsive to short-term price swings. Previous cycles have shown similar patterns near market lows, where reduced retail involvement coincided with the early stages of recovery.
At the same time, movements between exchanges provide insight into sentiment among more market participants. Recent flows show Bitcoin increasingly moving toward derivative platforms. Interestingly, this behavior is often linked to positioning strategies that anticipate higher prices, in which assets serve as collateral in leveraged setups.
Key Bitcoin Price Levels to Watch
From a valuation standpoint, pricing models based on realized value offer clues to the key levels to watch from the current standing. Martinez used the Market Value-to-Realized Value (MVRV) pricing bands to provide context.
Notably, Bitcoin has held above a key support level near $73,700, which aligns with the -0.5 MVRV pricing band. Maintaining this level keeps the path open for a move back toward the broader mean price range, estimated around $96,000.
However, if that support fails, the outlook will shift, with potential downside extending toward lower valuation bands near the realized price of $55,000.