
Influencer Sounds Alarm: Crypto Market Not Out of Woods Yet as Investors Flock to Low-Risk Assets
Bitcoin traded near $73,840 on May 31, 2026, stuck in a narrow band between $73,412 and $74,110 as technical indicators signaled bearish pressure and institutional players moved in opposite directions. With stablecoin dominance climbing, Tether burning over a billion dollars in 24 hours, and Blackrock offloading $2.1 billion worth of bitcoin over the last ten days, traders are watching a handful of key levels to determine whether the next move is a recovery or a flush toward $70,000.
Key Takeaways:
Tether burned $1.2 billion in 24 hours on May 31, matching a pattern that preceded Bitcoin’s drop from $90,000 to $60,000 in February 2026.
Blackrock removed $2.1 billion in bitcoin over ten days while firms like Strive acquired 1,100 $BTC in a single session, reflecting a split in institutional conviction.
Polymarket priced an 85% chance Bitcoin reaches $70,000 before $90,000, with TradingView moving averages confirming a strong sell posture at current levels.
1-Hour Chart: Compression at Resistance
On the 1-hour chart, bitcoin has built a series of higher lows since testing $73,100, which is a structure that hints at short-term buying interest. However, price has repeatedly been rejected near $74,100 to $74,200, and the repeated ceiling tests have compressed price into an increasingly tight range.
The intraday support zone sits between $73,600 and $73,700, with $73,100 serving as the critical floor below it. A confirmed hourly close above $74,200 would open a path toward $75,000 and then $76,000. A close below $73,500 flips the near-term structure bearish and brings $73,100, then $72,400, back into focus. Momentum at this timeframe is muted, and volume has not confirmed a directional commitment in either direction.
$BTC/USD 1-hour chart via Bitstamp on May 31, 2026. Image source: bitcoinwisdom.io.
4-Hour Chart: Sideways After a Sharp Selloff
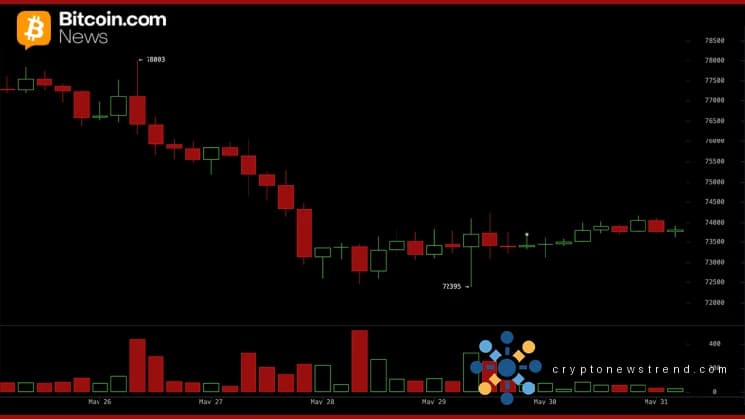
The 4-hour chart tells a story of consolidation following a meaningful decline. Bitcoin dropped sharply from roughly $78,000 into a low near $72,400, and price has been range-bound between $73,000 and $74,500 since that selloff. Volume has fallen steadily during the sideways period, signaling that neither buyers nor sellers are pressing their position at current levels.
The structure resembles an accumulation range but has not produced a confirming breakout. Traders looking for an aggressive entry point are watching the $73,000 to $73,300 zone, while a more conservative entry requires a sustained close above $74,200 to $74,500. The first meaningful upside target sits at $74,500, followed by $76,000 and $77,500 on a broader recovery. A break and hold below $72,400 invalidates the consolidation thesis and risks opening a move toward $71,000 to $70,000.
$BTC/USD 4-hour chart via Bitstamp on May 31, 2026. Image source: bitcoinwisdom.io.
Daily Chart: Bearish Structure Intact
The daily chart remains the hardest read for bulls. Bitcoin has printed a series of lower highs and lower lows since topping near $82,800, forming a clear downtrend. The most recent daily low came in around $72,400 before a small bounce, but no reversal candle or reclaim of higher ground has confirmed that the downtrend is over.
Volume picked up during the selloff, which analysts read as genuine distribution rather than a temporary shakeout. Daily resistance sits at $74,500, $76,000, and $77,500. The broader trend bias stays neutral-to- bearish until bitcoin reclaims the $76,000 to $77,000 zone on a daily close. TradingView’s aggregate moving average panel reflects this, with 11 of 15 moving averages issuing sell signals against the current price, including the 10, 20, 30, 50, and 200-period exponential and simple moving averages.
$BTC/USD 1-day chart via Bitstamp on May 31, 2026. Image source: bitcoinwisdom.io.
Influencers and Prediction Markets Sound Warnings
Some of the most-followed voices in the bitcoin space spent the final days of May issuing direct caution. Crypto Rover, a Youtuber with over 200,000 subscribers, flagged on Sunday that Tether’s market cap dropped $1.2 billion in 24 hours, noting that token burns only occur when real dollars exit the system. He pointed to a similar Tether outflow that preceded bitcoin’s decline from $90,000 to $60,000 in February as a comparison.
Image source: X.
In a separate post the same morning, Crypto Rover observed stablecoin dominance, measured as USDT.D plus USDC.D, reclaiming the bull market support band above 10.5%, which he described as a classic risk-off rotation out of bitcoin and into cash equivalents. Furthermore, Polymarket data shows an 85% probability that bitcoin touches $70,000 before reaching $90,000. Meanwhile, several market observers also noted that Blackrock’s IBIT had offloaded $2.1 billion worth of bitcoin over the last ten days.
Oscillators and Moving Averages: Neutral Meets Strong Sell
The technical picture as of Sunday morning (7:30 a.m. ET) is split between several readings that do not point in the same direction. The oscillator composite comes in neutral, with the 14-period relative strength index ( RSI) at 37, the Stochastic RSI Fast at 10 flashing bullish, and the commodity channel index (CCI) at negative 117, also signaling upside. The moving average convergence/divergence ( MACD) level sits at negative 1,105, pointing lower, and the momentum indicator at negative 3,843 echoes that reading. The net result across most oscillators is a neutral aggregate, which reflects the range-bound price action rather than any committed directional move.
The moving average (MA) panel tells a different story. The 10-, 20-, 30-, 50-, and 200-period exponential and simple moving averages all sit above the current price and flag bearish pressure. Only the 100-period simple moving average at $73,167 and the Hull moving average at $72,795 lean bullish. The volume-weighted moving average at $77,393 adds to the bearish tilt. The overall moving average summary registers a strong bearish lean, meaning the current price sits below most medium and long-term trend benchmarks. Until bitcoin reclaims those levels, the technical backdrop will continue to favor the downside even as short-term charts show stabilization.
Bull Verdict:
Bitcoin has held above $72,400 through sustained selling pressure, corporate buyers are still stepping in at current levels with record single-day purchases, and the short-term chart structure shows higher lows forming. A confirmed hourly close above $74,200 opens the door to $76,000 and beyond.
Bear Verdict:
Eleven of fifteen moving averages point lower, Blackrock pulled $2.1 billion from the market over ten days, Tether burned $1.2 billion in 24 hours, matching a pattern that preceded a drop from $90,000 to $60,000, and Polymarket gives 85% odds bitcoin touches $70,000 before it sees $90,000. The daily trend remains a sequence of lower highs and lower lows with no confirmed reversal in sight.